
Satellite-derived isoprene emission estimates based on TROPOMI HCHO and NO2 columns
View the data
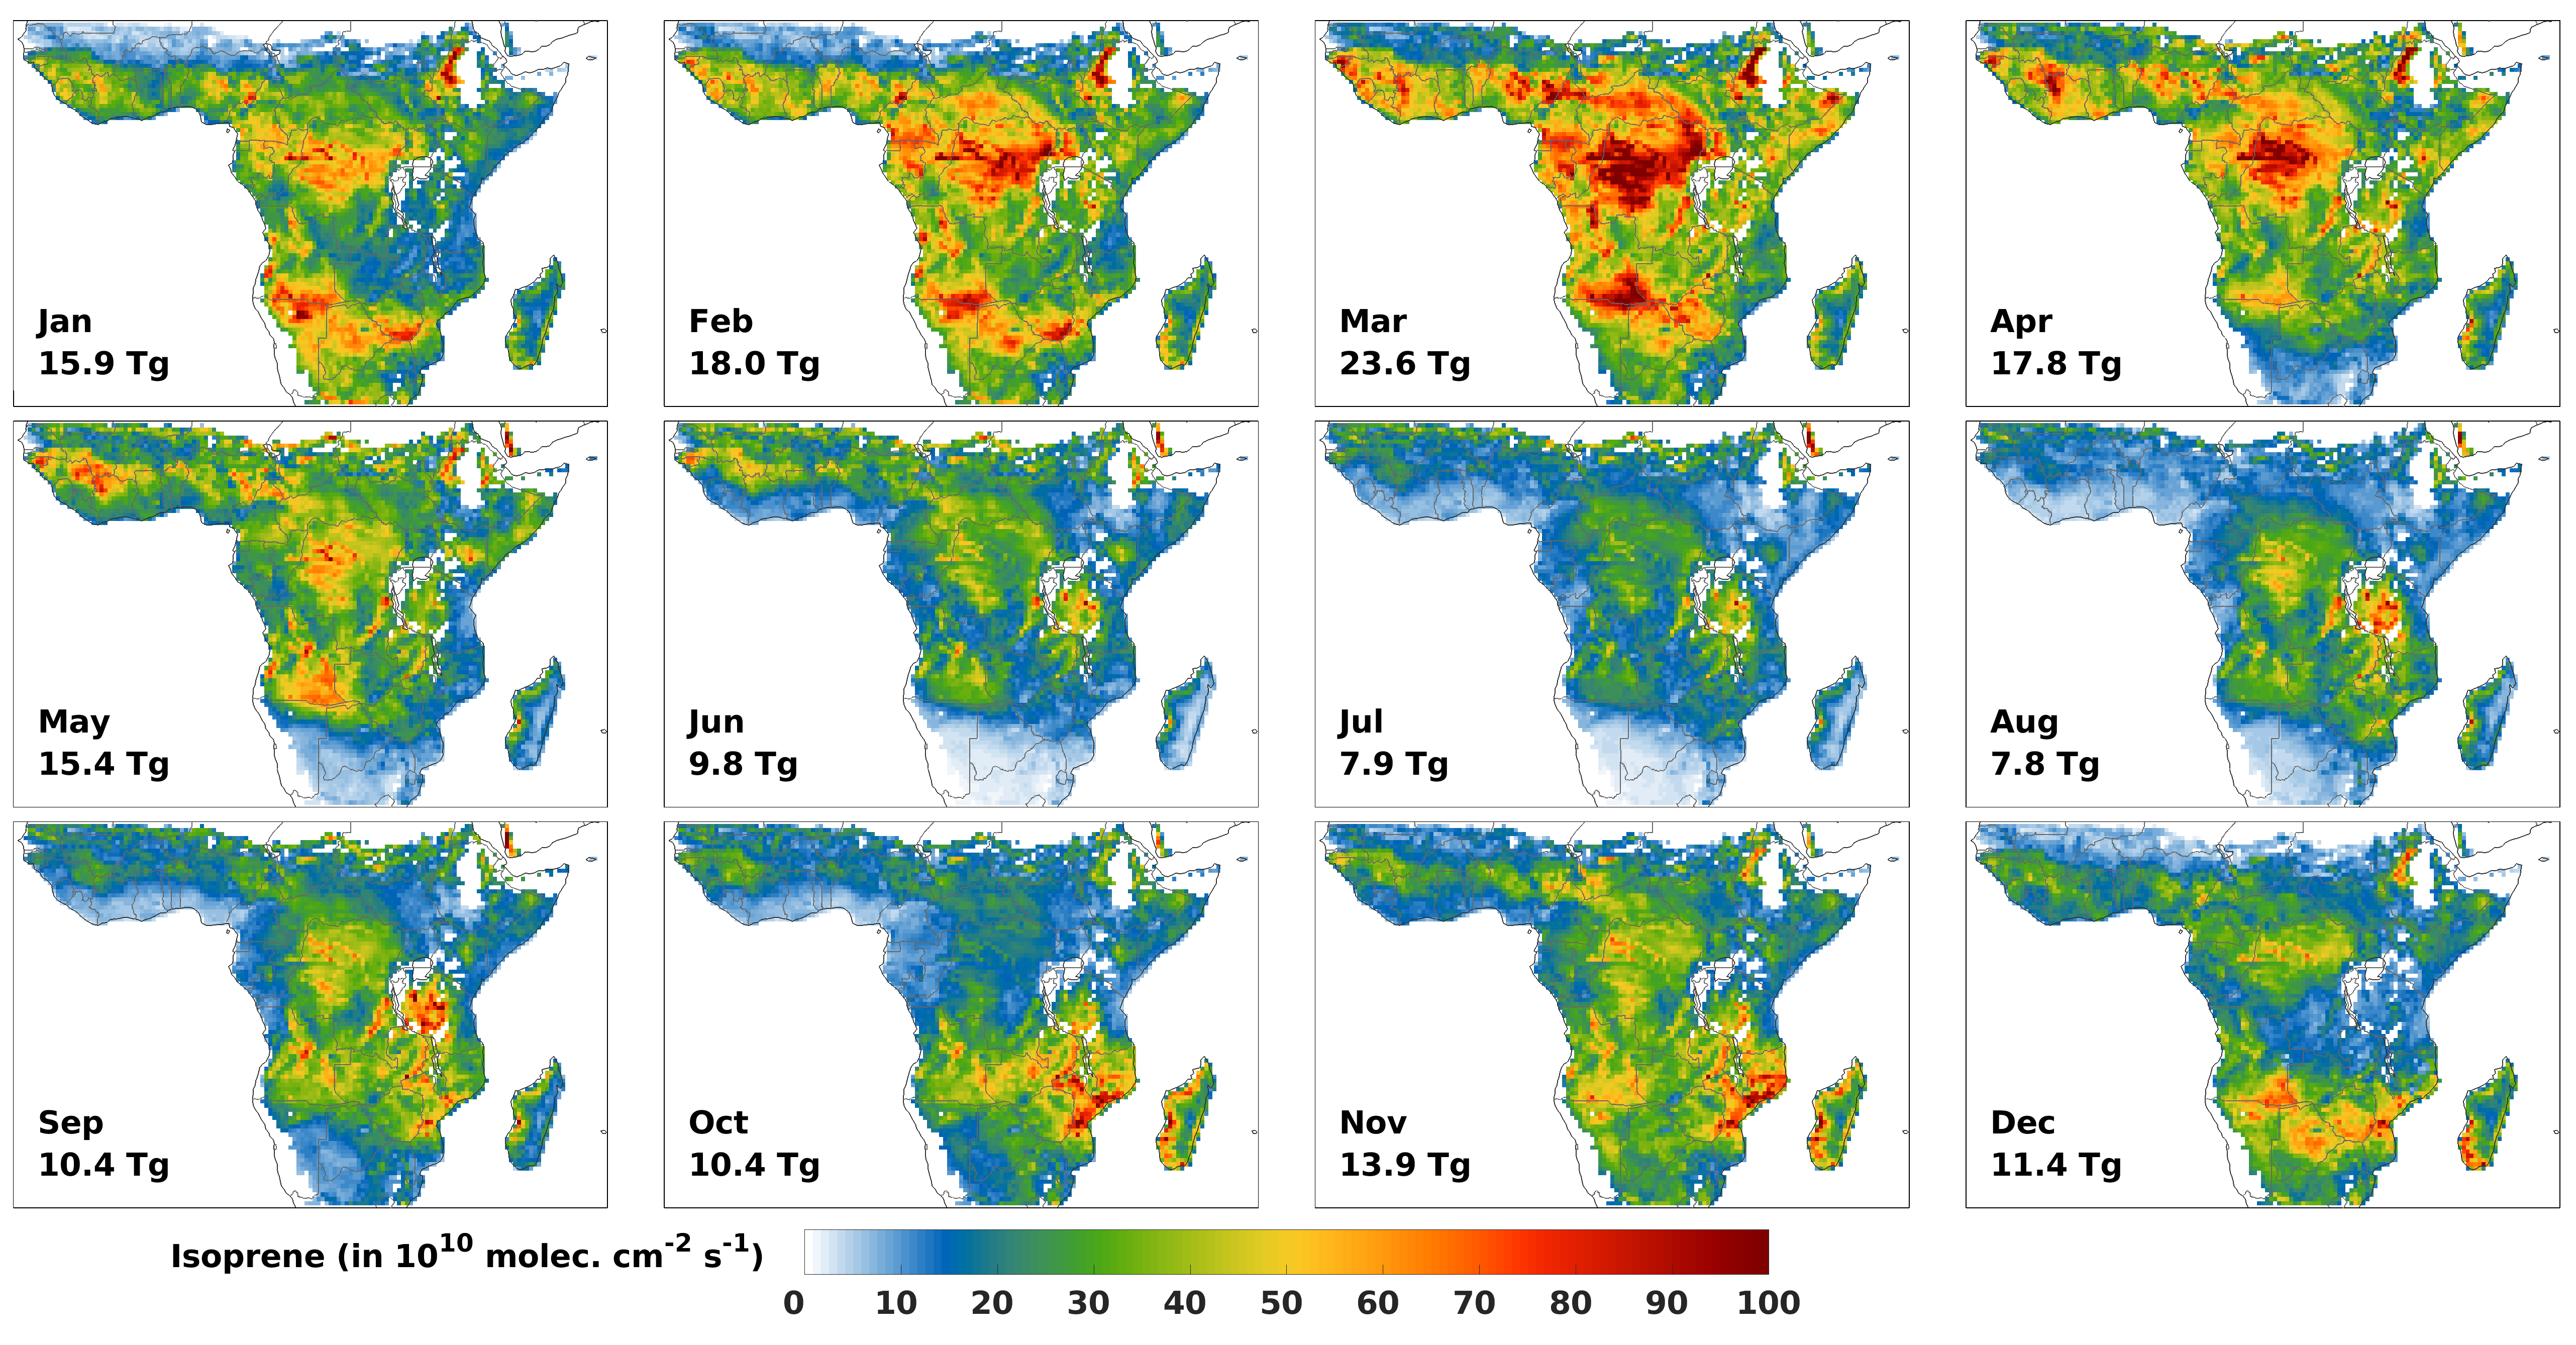
Top-down monthly isoprene emission distributions in 2019 (in 1010 molecules cm-2 s-1) with total monthly emissions over the domain provided inset in GgN.
About the data
The top-down emissions are inferred from an inverse modelling scheme built on the chemistry-transport model MAGRITTEv1.1 and its adjoint (Müller et al., 2019; Bauwens et al., 2016; Müller and Stavrakou, 2005), constrained by TROPOMI NO2 (van Geffen et al., 2022) and HCHO (De Smedt et al., 2018) column data through a joint inversion.
This accounts for the intricate interplay between NOx and VOCs through the chemical feedbacks of the HOx-NOx-VOC system, by relying on a concomitant use of HCHO and NO2 satellite observations in order to simultaneously optimize both VOC and NOx emissions (Opacka et al., in preparation).
Download
Monthly emissions over Africa (17°N-30°S and 18°W-56°E) are available in NetCDF format at a resolution of 0.5°x0.5°.
Technical information is available in this readme file.
Acknowledgements
The development of this dataset was made possible thanks to the support of the European Space Agency (ESA) EO Science for Society programme through the IMPALA (IMProved Atmospheric emissions using Low-earth satellites over Africa, 2023-2024) project.


