
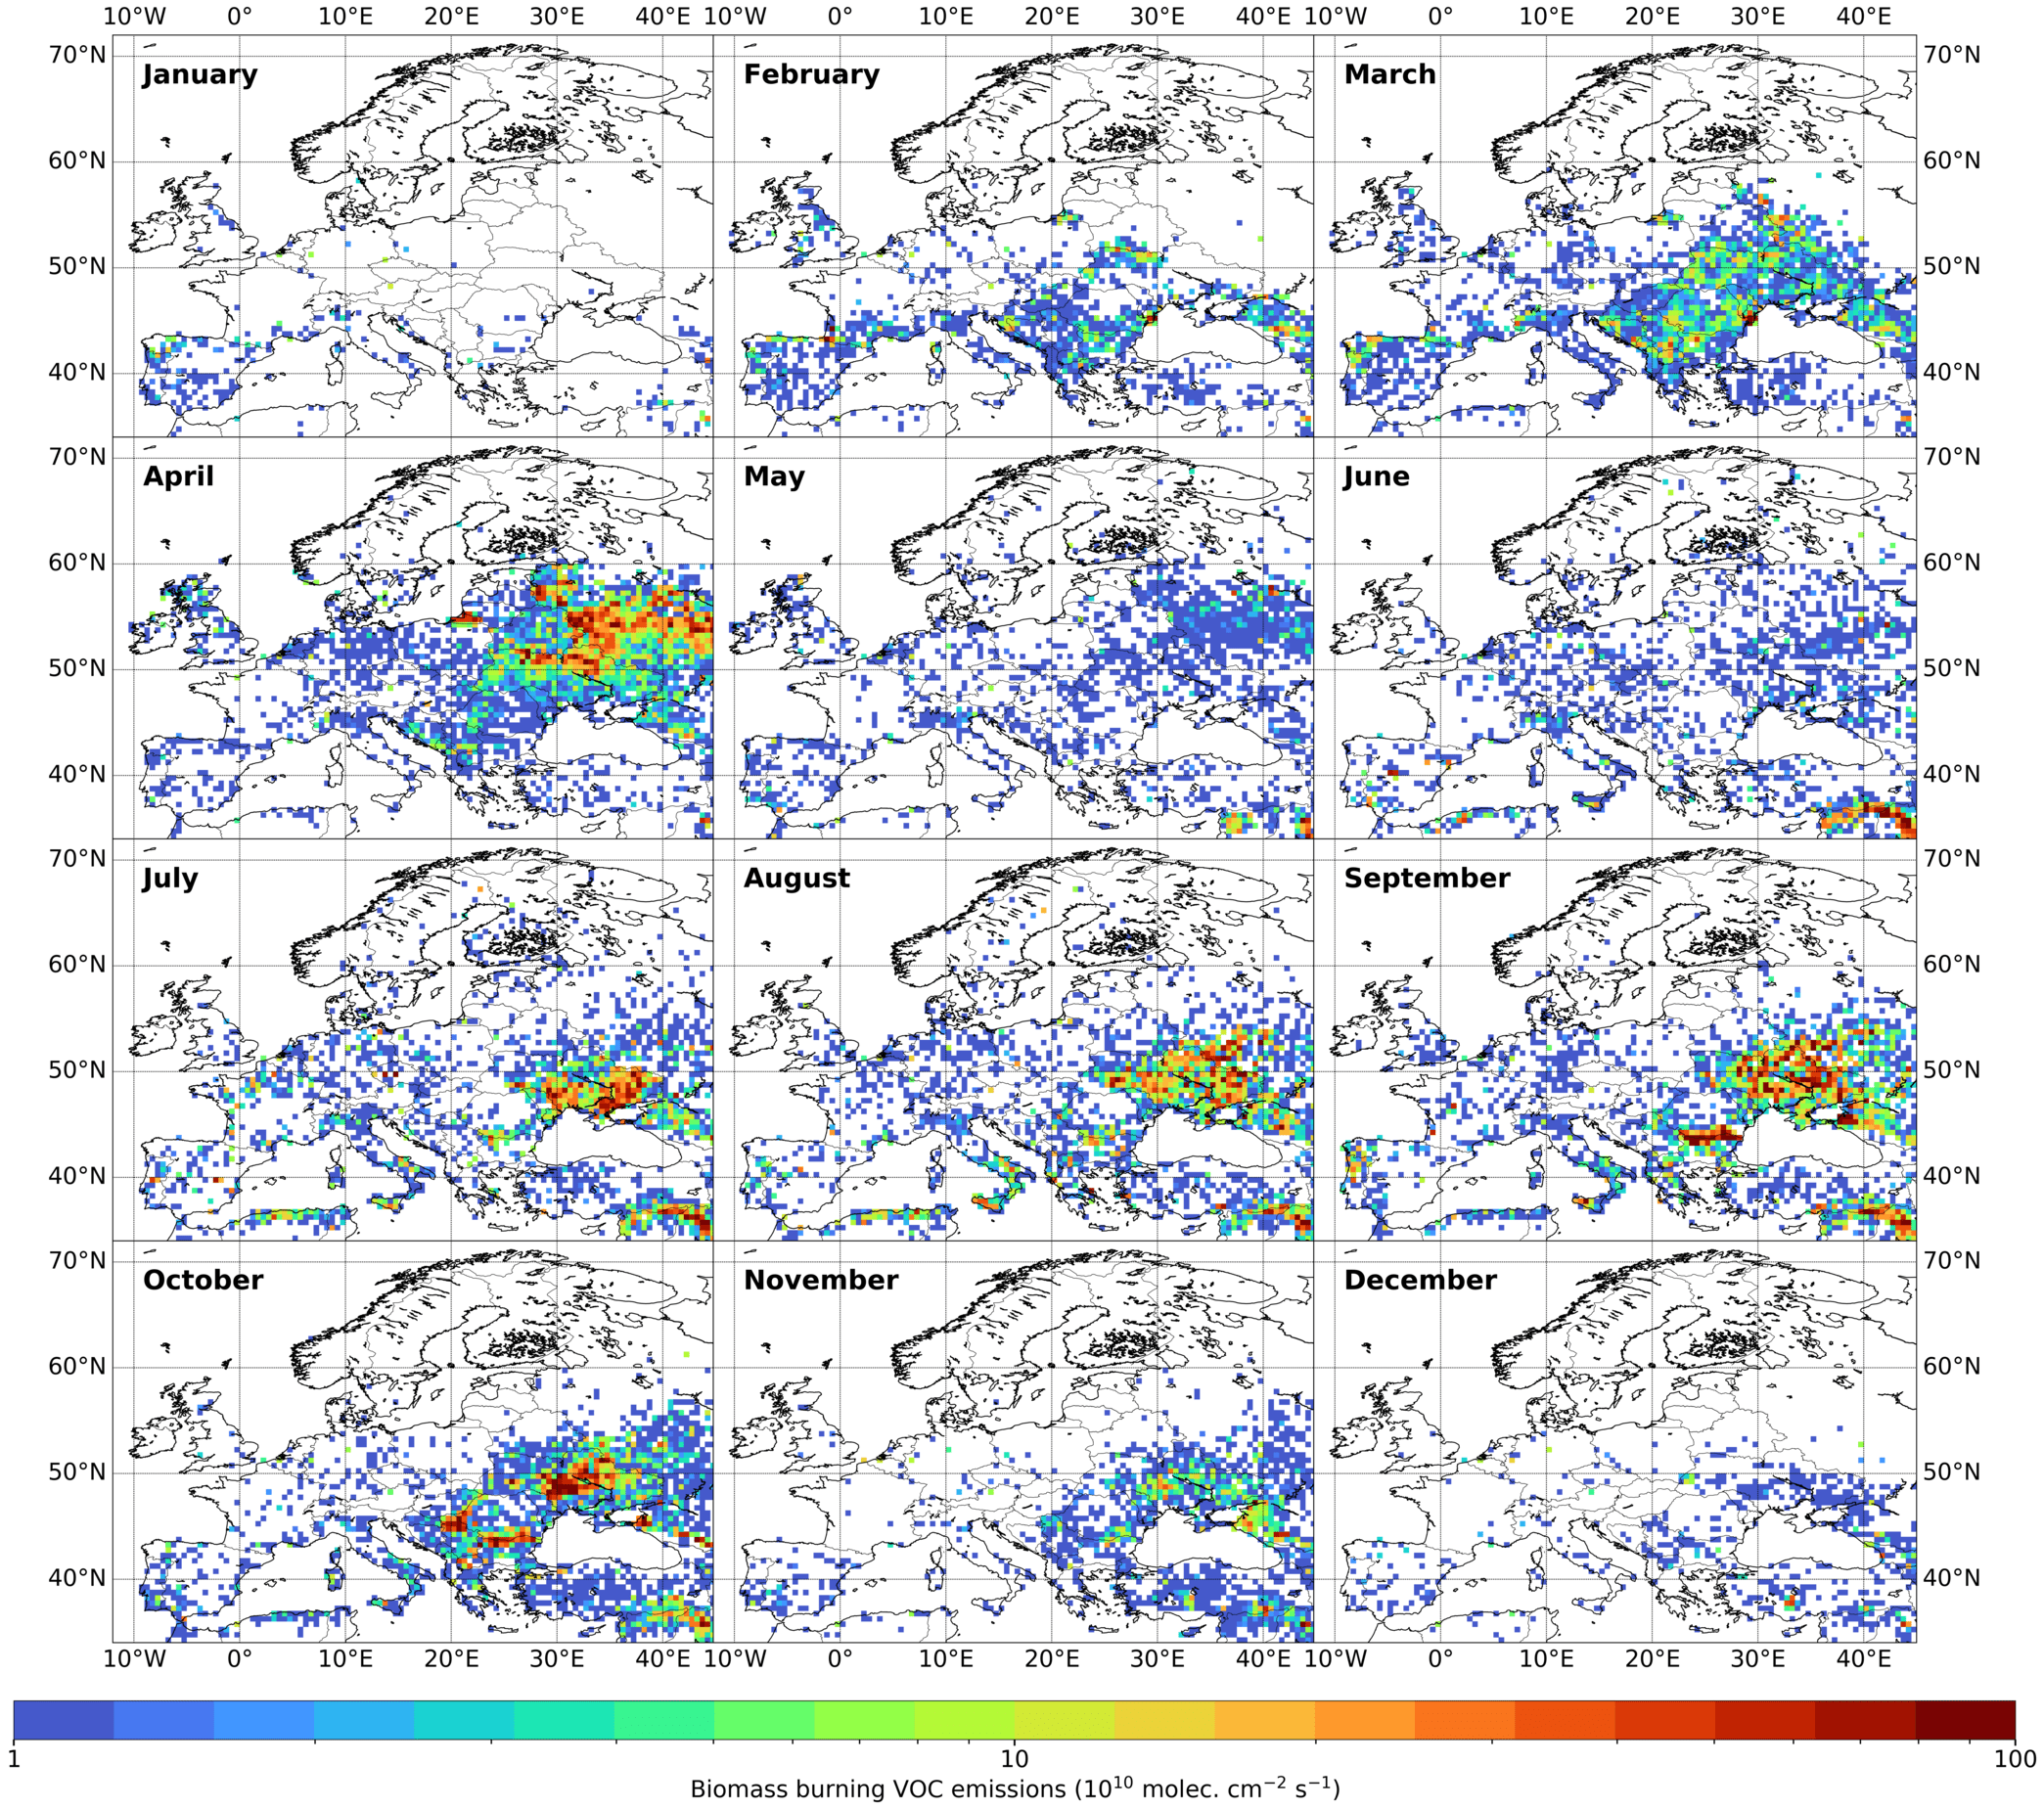
Satellite-derived biomass burning emission estimates based on TROPOMI HCHO columns
View the data (year 2019)
About the data
Top-down biomass burning emission dataset derived based on an inversion with the MAGRITTEv1.1 chemistry transport model (Müller et al. 2019) and its adjoint, and are constrained by TROPOMI HCHO vertical columns. We used the operational L2 data product of TROPOMI at resolution averaged weekly, and with a clear sky requirement higher than 80%.
In the inversion process, the different emission categories (biogenic, anthropogenic, and biomass burning) are optimized simultaneously. The a priori inventories used as input for the inversion are:
- MEGAN-MOHYCAN for biogenic emissions (Stavrakou et al. 2018),
- CAMS-GLOB-ANT for anthropogenic emissions (Granier et al., 2019), and
- QFEDv2.1 for biomass burning emissions (Darmenov & da Silva, 2015).
The inversion is performed at a spatial resolution of 0.5°x0.5° and a weekly temporal resolution (Oomen et al. 2021). The inversion spans four years (2018-2021) and only summer months (May-September) have been optimized due to the lower data quality in winter. The TROPOMI HCHO vertical columns have been corrected for a bias with respect to ground-based stations in Europe.
The bias correction was derived based on a network of seven FTIR stations located in Sweden (Kiruna), Finland (Sodankylä), Russia (St. Petersburg), Germany (Bremen, Karlsruhe, and Garmisch), and France (Paris). The bias correction is given by 1.48x[TROP]-1.40x10¹⁵ molec. cm-2, where [TROP] is the TROPOMI HCHO vertical column in molecules per square cm. This dataset is made available as part of a publication submitted to ACP.
Download
Weekly emissions are available in NetCDF format at a resolution of 0.5°x0.5°.


