
MEGAN-MOHYCAN : Methanol emission inventory 2005-2016
View the data
Download
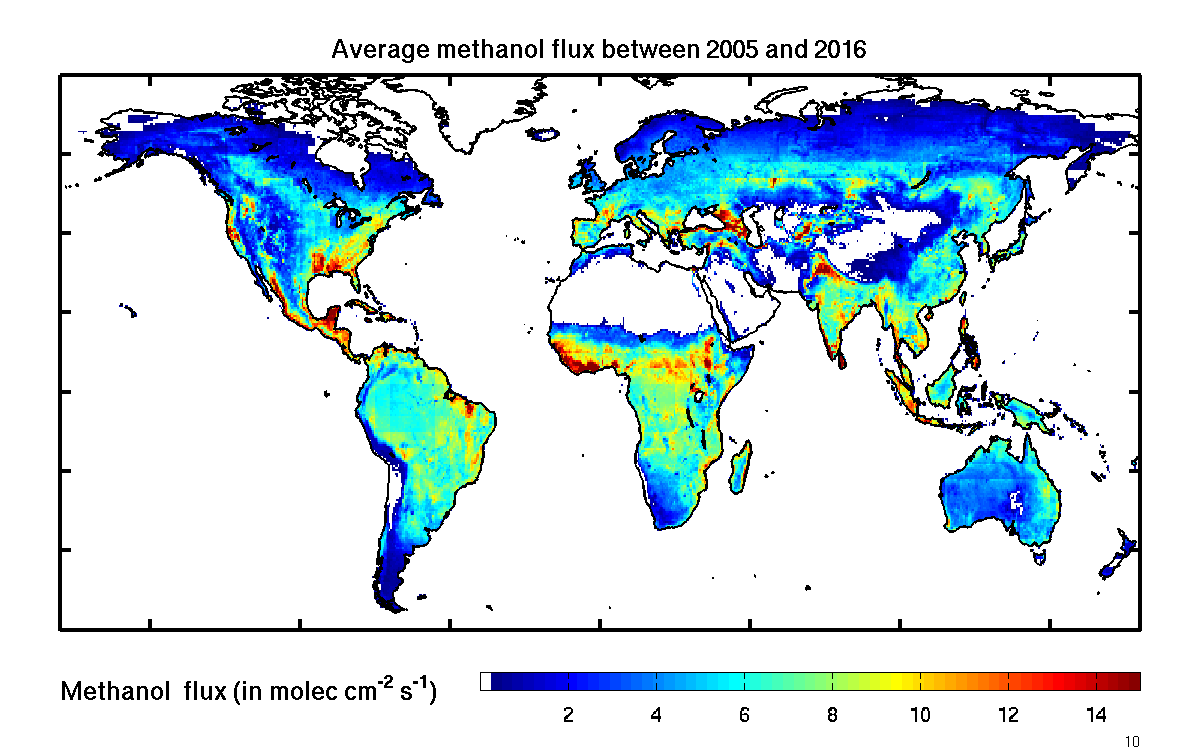
Here we provide a global dataset from 2005 to 2016. Monthly averaged emissions (in molec cm-2 s-1) are available in NetCDF format: 720 longitudes from 0.25 to 359.75° W, 360 latitudes from 89.75° N to 89.75° S, 12 months.
About the dataset
Based on the MEGANv2.1 emission model, the MOHYCAN canopy environment model, ERA-Interim fields between 2005 and 2016 and leaf area index from collection 5 8-day MODIS composite from Aqua and Terra, we have built a global inventory of methanol emissions from vegetation at a resolution of 0.5°. The dataset is described in full detail in Stavrakou et al., (2011).
We provide above the biogenic methanol source is calculated using MEGANv2.1 for every year multiplied by biogenic emission updates derived by inverse modeling of IASI observations for the year 2009 (Stavrakou et al. 2011).
References
- Stavrakou, T., Guenther, A., Razavi, A., Clarisse, L., Clerbaux, C., Coheur, P.-F., Hurtmans, D., Karagulian, F., De Mazière, M., Vigouroux, C., Amelynck, C., Schoon, N., Laffineur, Q., Heinesch, B., Aubinet, M., Rinsland, C., and Müller, J.-F. (2011) First space-based derivation of the global atmospheric methanol emission fluxes, Atmospheric Chemistry and Physics, 11, 4873-4898, https://doi.org/10.5194/acp-11-4873-2011.


